Shared PPM Dashboard Pages and Portlets
APM provides several shared PPM Dashboard pages and portlets for APM analysts. You cannot edit or delete shared PPM Dashboard pages and portlets.
This section provides a screenshot and description of each of the portlets included on the following shared PPM Dashboard pages:
For more information about shared portlets, see the online help. For information about how to use the PPM Dashboard pages, see PPM Dashboard and PPM Dashboard pages.
Front Page
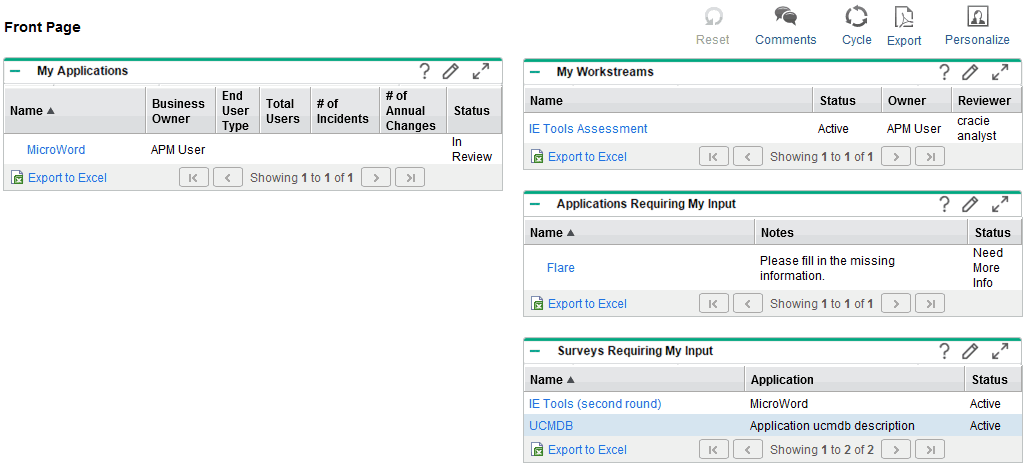
The Front Page shared PPM Dashboard page for APM analysts displays portlets that contain information that you might want to track regularly. These portlets include information about the applications in the portfolio, workstreams you manage, transformation proposals you have defined, surveys being conducted, and applications that are not mapped to processes.
Figure B-1. Example of the Front Page page

|
Portlet Name |
Description |
|---|---|
|
Applications |
This portlet displays a list of all applications in your organization's portfolio. Use this portlet to track basic information about an application. The following columns are displayed: Name, Business Owner, Disposition, Disposition Status, Total Score, Last Update Date, and Status. By default, applications are listed by the date they were last updated, with the most recently updated applications shown first. |
|
Applications Not Mapped to Process |
This portlet displays a list of all applications in your organization's portfolio that are not assigned to a business process. Use this portlet to view all applications that do not contribute to any business process. The following columns are displayed: Name, Business Owner, Disposition, Total Score, and Status. By default, applications are listed alphabetically by name. |
|
My Workstreams |
This portlet displays a list of all the workstreams you created, own, have been asked to review, or for which you are a resource. Use this portlet to view the workstreams that you manage. The following columns are displayed: Name, Owner, Reviewer, and Status. By default, workstreams are listed alphabetically by name. |
|
My Transformation Proposals |
This portlets displays all active and approved transformation proposals that you created or own. Use this portlet to view transformation proposals that can be developed as projects. The following columns are displayed: Name, Owner, Total Score, and Status. By default, transformation proposals are listed alphabetically by name. |
|
My Survey Requests |
This portlet displays all active survey requests crated by you or other APM users. Use this portlet to keep track of the surveys conducted by APM users. The following columns are displayed: Name, End Date, and Status. By default, survey requests are listed alphabetically by name. |
Portfolio View
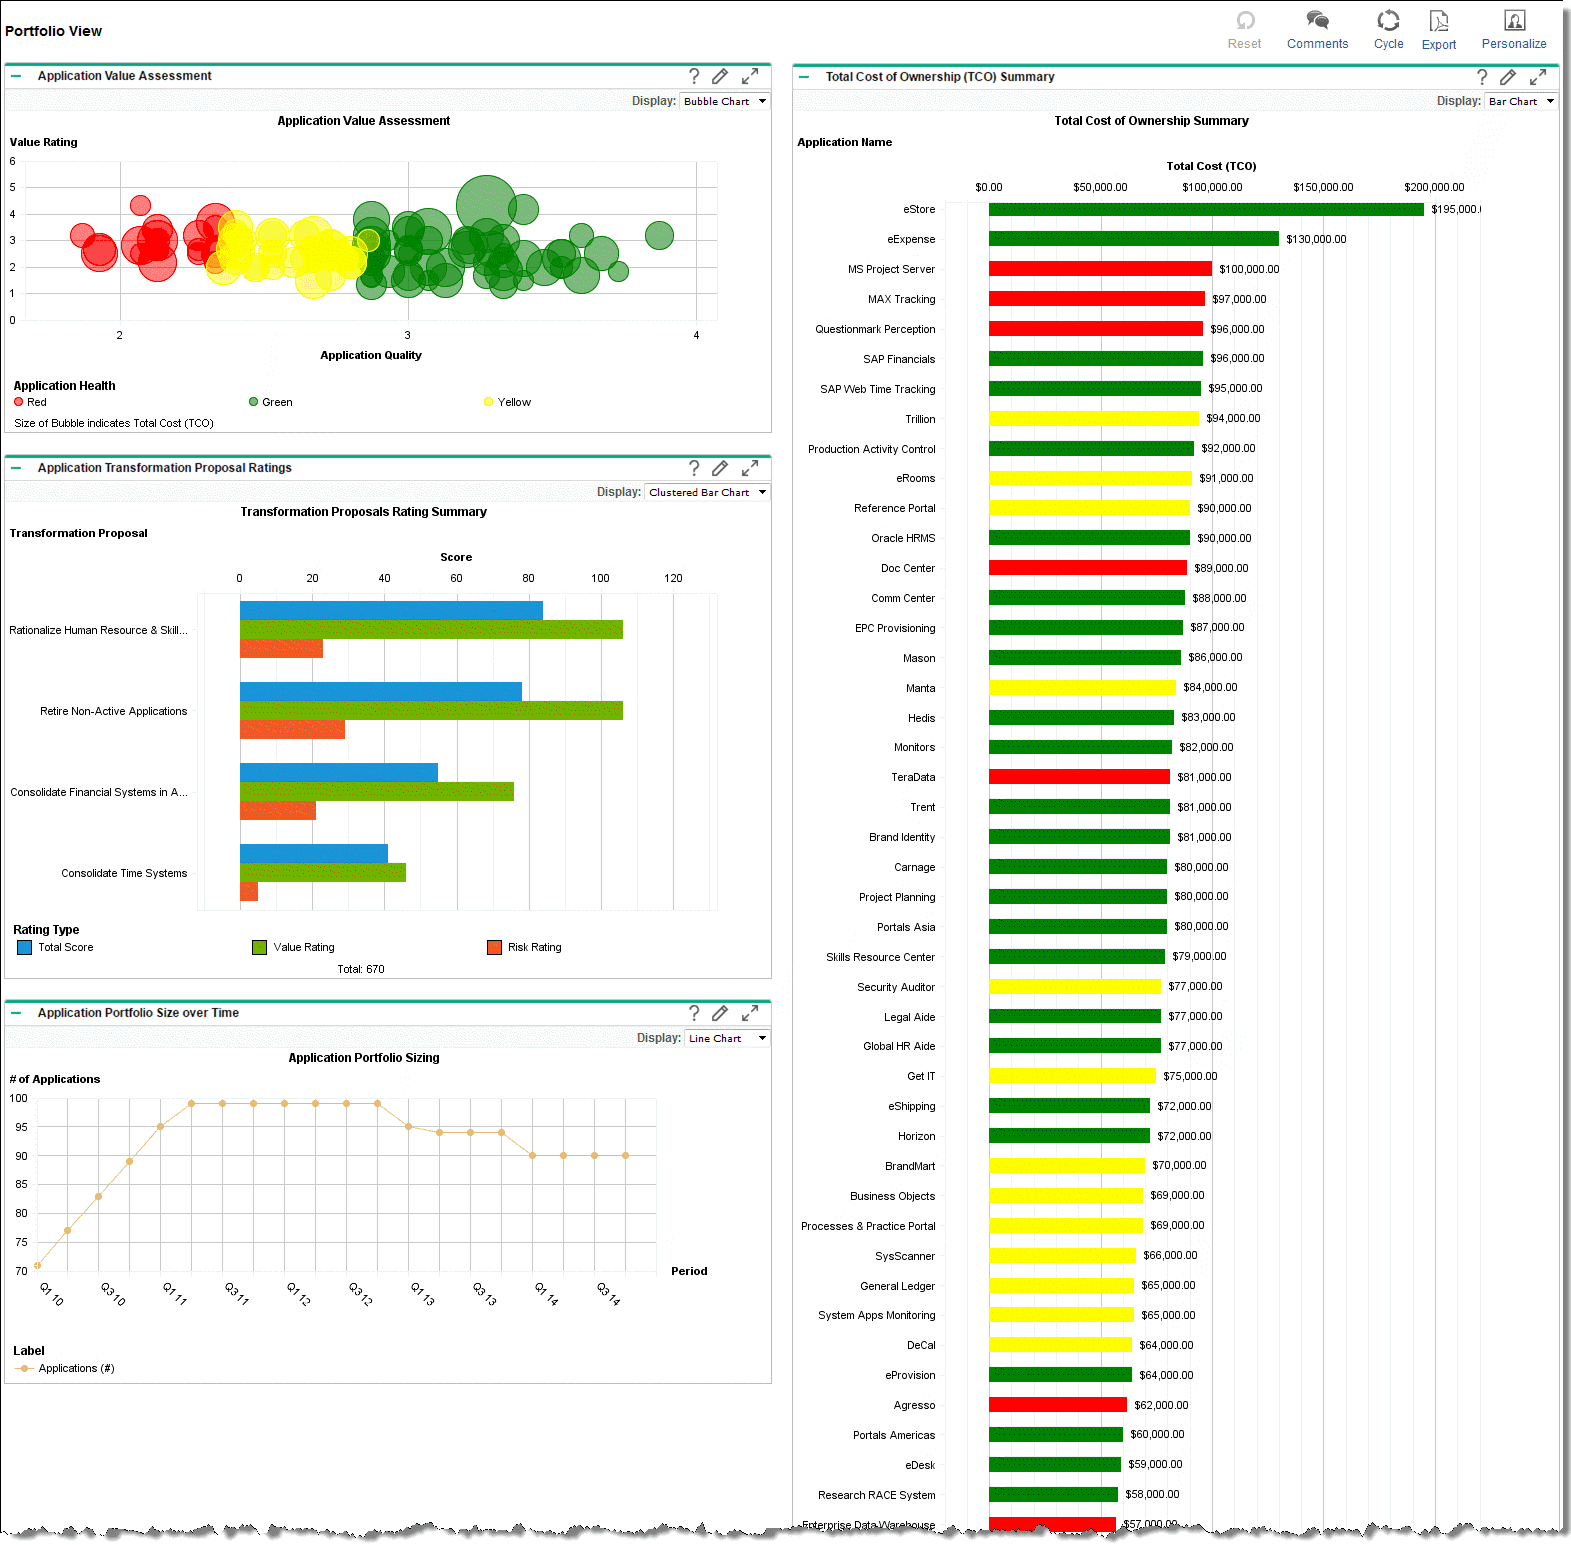
The Portfolio View shared PPM Dashboard page for APM analysts displays portlets that provide application portfolio information you might want to track regularly. This includes an assessment of an application's value, transformation proposal ratings, the number of applications in the portfolio, and an application's total cost of ownership.
Figure B-2. Example of shared portlets on the Portfolio View PPM Dashboard page

|
Portlet Name |
Description |
|---|---|
|
Application Value Assessment |
This portlet displays an application's quality, health, value rating, and total cost of ownership. This portlet can be displayed as a bubble chart (default) or list. Use the information to determine if an application needs to be assessed (for example, for modernization). |
|
Application Transformation Proposal Ratings |
This portlet displays the total score, value rating, and risk rating by transformation proposal. This portlet can be displayed as a clustered bar chart (default), stacked bar chart, or list. Use this portlet to view how transformation proposals are ranked based on their total score. In the clustered bar chart and stacked bar chart, by default, applications are listed numerically (highest to lowest) by total score. |
|
Application Portfolio Size over Time |
This portlet displays the number of applications in the portfolio over a period of time. This portlet can be displayed as a line chart (default), XY chart, radar chart, or list. Use this portlet to track how many applications are in the portfolio over a specified period of time. By default, Period Type is set to Quarter. |
|
Total Cost of Ownership (TCO) Summary |
This portlet displays the total cost of ownership by applications in the portfolio. This portlet can be displayed as a bar chart (default), pie chart, or list. Use this portlet to determine the total cost to own and operate an application. In the bar chart and pie chart, by default, applications are listed numerically (highest to lowest) by cost. |
Applications
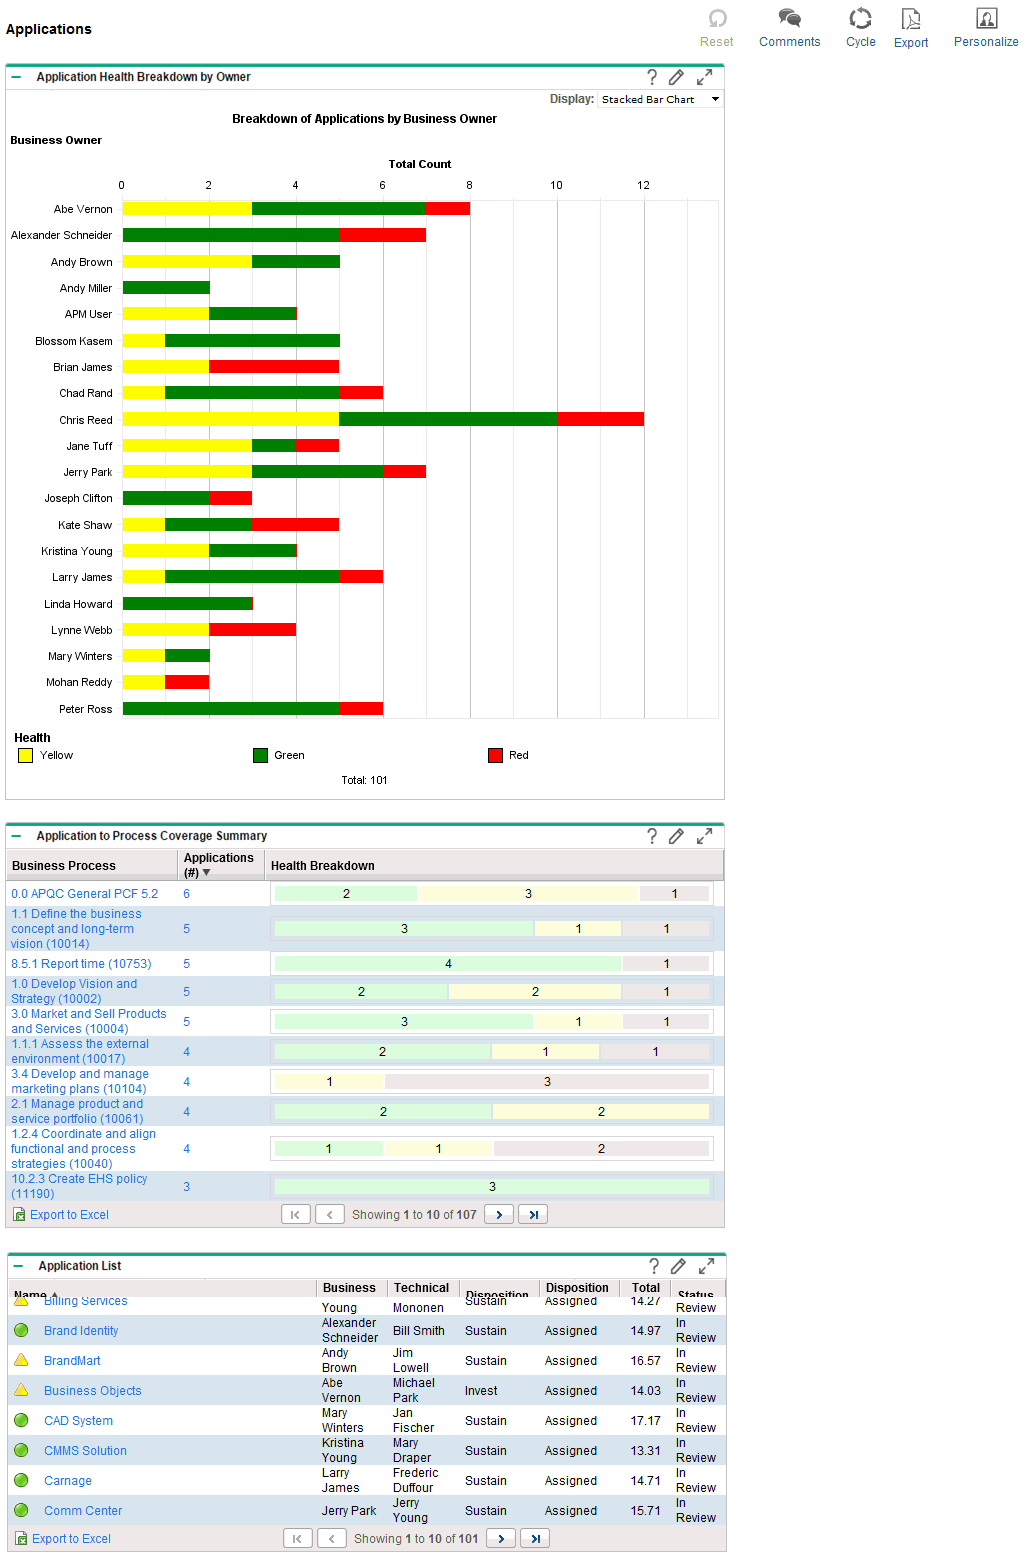
The Applications shared PPM Dashboard page for APM analysts displays portlets with application information that the you might want to track regularly. This includes an application's health by owner, the number of applications that support a process, and a list of all applications in the portfolio.
Figure B-3. Example of the shared Applications page

|
Portlet Name |
Description |
|---|---|
|
Application Health Breakdown by Owner |
This portlet displays the number of applications by health for each business owner. This portlet can be displayed as a stacked bar chart (default), clustered bar chart, or list. Use this portlet to track how many applications are owned by each business owner and the health of each application. From this portlet, you can drill down to display, for the selected application, the application's health, name, business owner, technical owner, disposition, disposition status, total score, and status. |
|
Application to Process Coverage Summary |
This portlet displays the number of applications that support each business process and the health of the applications. Use this portlet to determine how many applications support a business process and the health of each application. The following columns are displayed: Business Process, Applications (#), and Health Breakdown. |
|
Application List |
This portlet displays a list of all applications in your organization's portfolio. Use this portlet to view basic information about an application. The following columns are displayed: Name, Business Owner, Technical Owner, Disposition, Disposition Status, Total Score, and Status. By default, applications are listed alphabetically by name. |


