TCO Summary
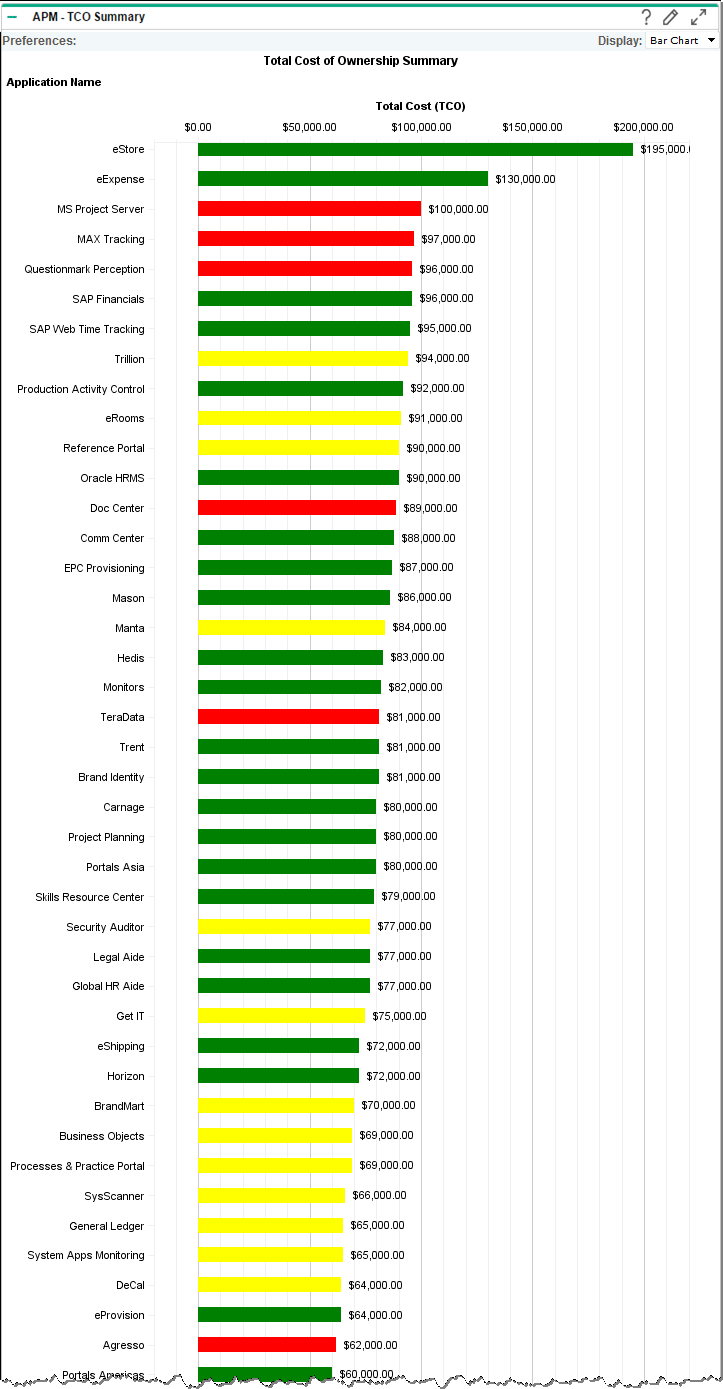
The TCO Summary portlet displays the total cost of ownership by application. This portlet can be displayed as a bar chart (default), pie chart, or list. Use this portlet to determine the total cost to own and operate an application.
In the bar chart and pie chart, by default, applications are listed numerically (highest to lowest) by cost.
Figure B-14. Example of the TCO Summary portlet

To select the type of data that is displayed in this portlet and how the data is displayed, set the preference settings and filters.
|
Field |
Description |
|---|---|
|
Application Set |
Select an application set to display in the portlet. The portlet displays the cost of ownership by applications in the application set. By default, the cost of ownership of all applications are displayed. |
|
Display preferences summary on portlet |
Display the preferences you have selected at the top of the portlet. |


