Stacked bar chart portlet
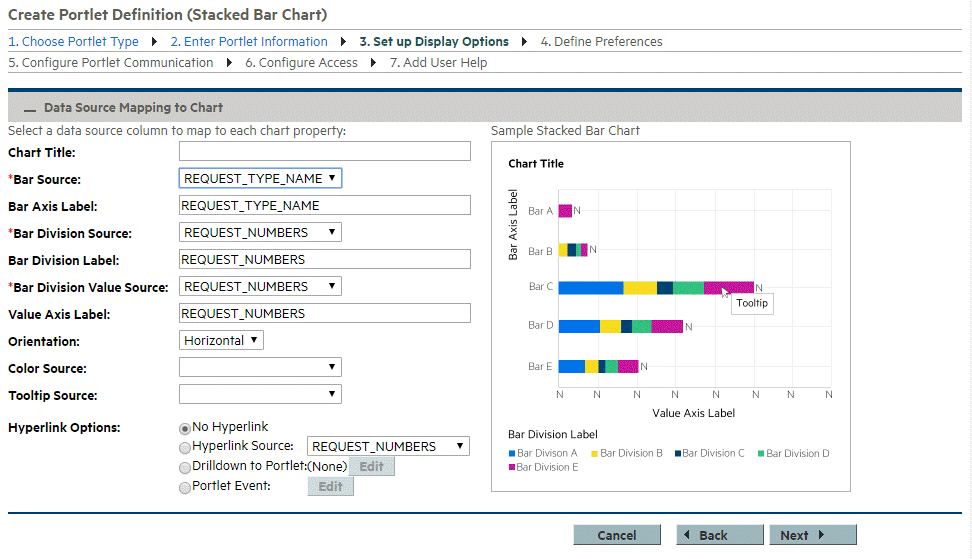
This topic provides details on how to set up display options for stacked bar chart portlet definitions.

|
Field Name (*Required) |
Description |
|---|---|
|
Chart Title |
Specify a name for the chart. Type any alphanumeric string (up to 200 characters in length). |
|
*Bar Source |
Select a source column for the information to be displayed on the bar axis. Choices are limited to those columns available in your portlet data source. |
|
Bar Axis Label |
Specify the label for the bar axis. Type any alphanumeric string (up to 200 characters in length). |
|
*Bar Division Source |
Select the source column for the bar divisions. Choices are limited to those columns available in your portlet data source. |
|
Bar Division Label |
Specify the label for the bar divisions. |
|
*Bar Division Value Source |
Select a numeric source column for the information to be displayed on the value axis (the length of each bar). Choices are limited to those columns available in your portlet data source. |
|
Value Axis Label |
Specify the label for the value axis. Type any alphanumeric string (up to 200 characters in length.) |
|
Orientation |
Indicate the orientation of the bars. Choices include:
|
|
Color Source |
Select the source for the color. See Customize portlet colors for details. |
|
Tooltip Source |
Select the source column for the tooltip to be displayed when the cursor hovers over an item. Choices are limited to those columns available in your portlet data source. |
|
Hyperlink Options |
Specify whether the column can be linked to another page or portlet, or updates the other portlets on this page. Choices include:
|


